Environment, infrastructure, and everyday health in Ontario.
EcoHealth Ontario covers the connection between where you live and how you live. The places people call home, the water they drink, the streets they walk on, the air they breathe, and the public spaces they share all have measurable effects on long-term health. We write about those connections in practical, Ontario-specific terms.
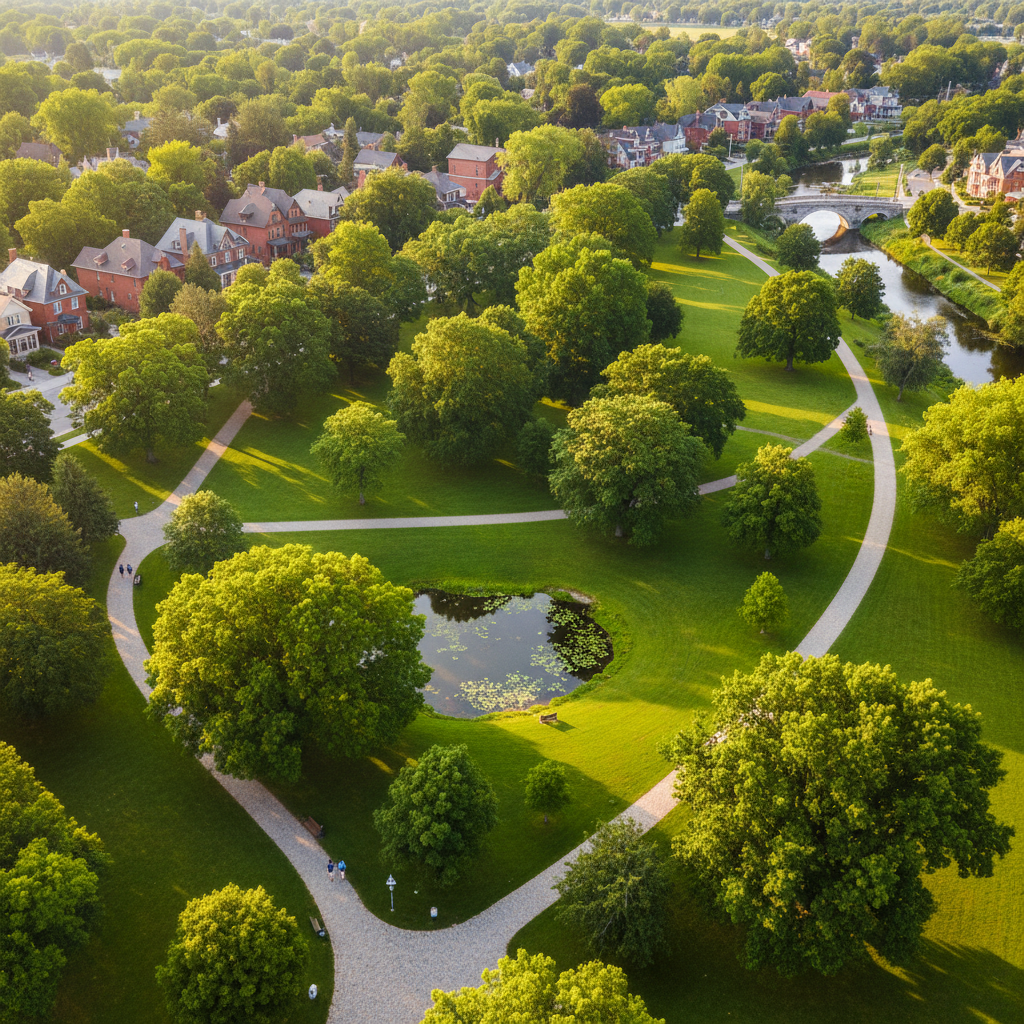
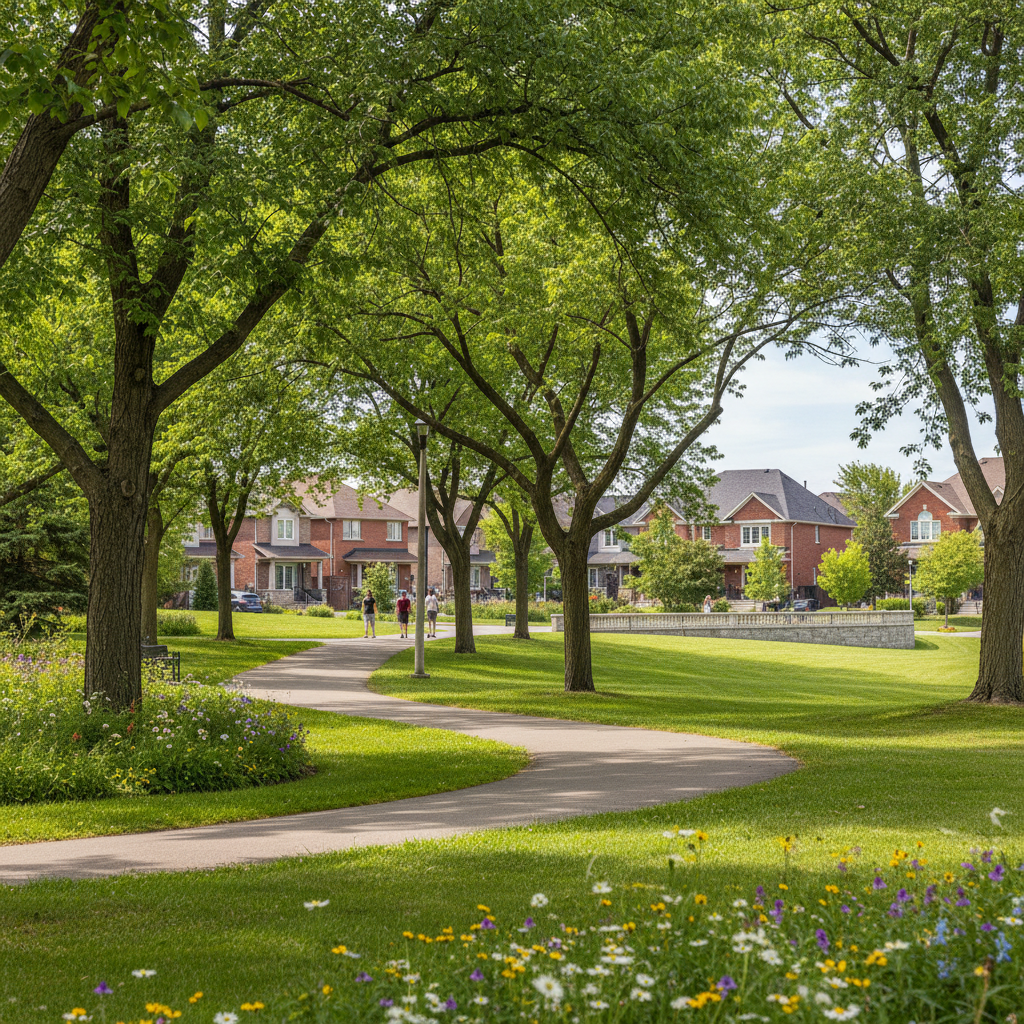
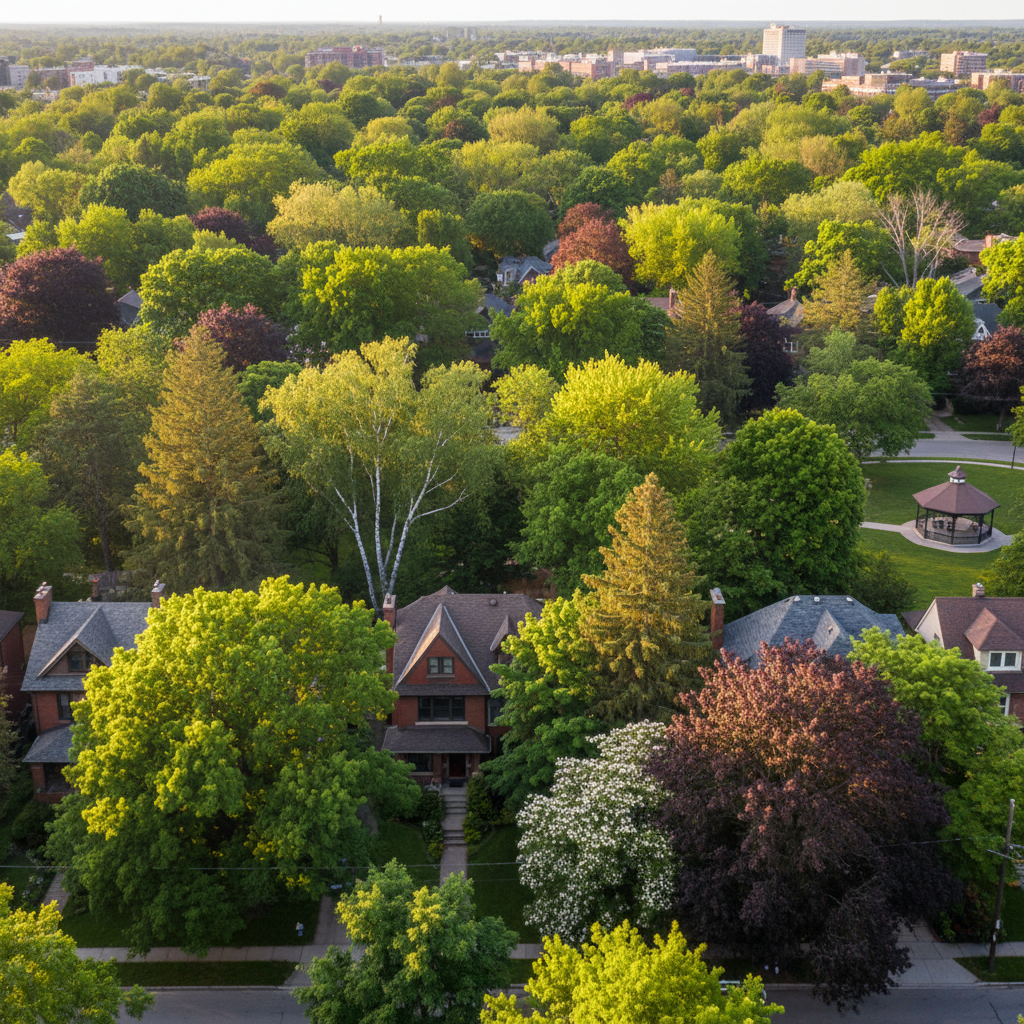
Most conversations about health in Ontario focus on hospitals and wait times. Those matter. But the physical features of a community, from sidewalk completeness to tree canopy to stormwater infrastructure, matter just as much. Research from public health agencies across Canada shows clear links between the built environment and cardiovascular disease, respiratory illness, mental health outcomes, and childhood development. A neighbourhood with mature trees, complete sidewalks, clean drinking water, and low traffic noise is measurably healthier than one without those features, even when income and demographics are similar.
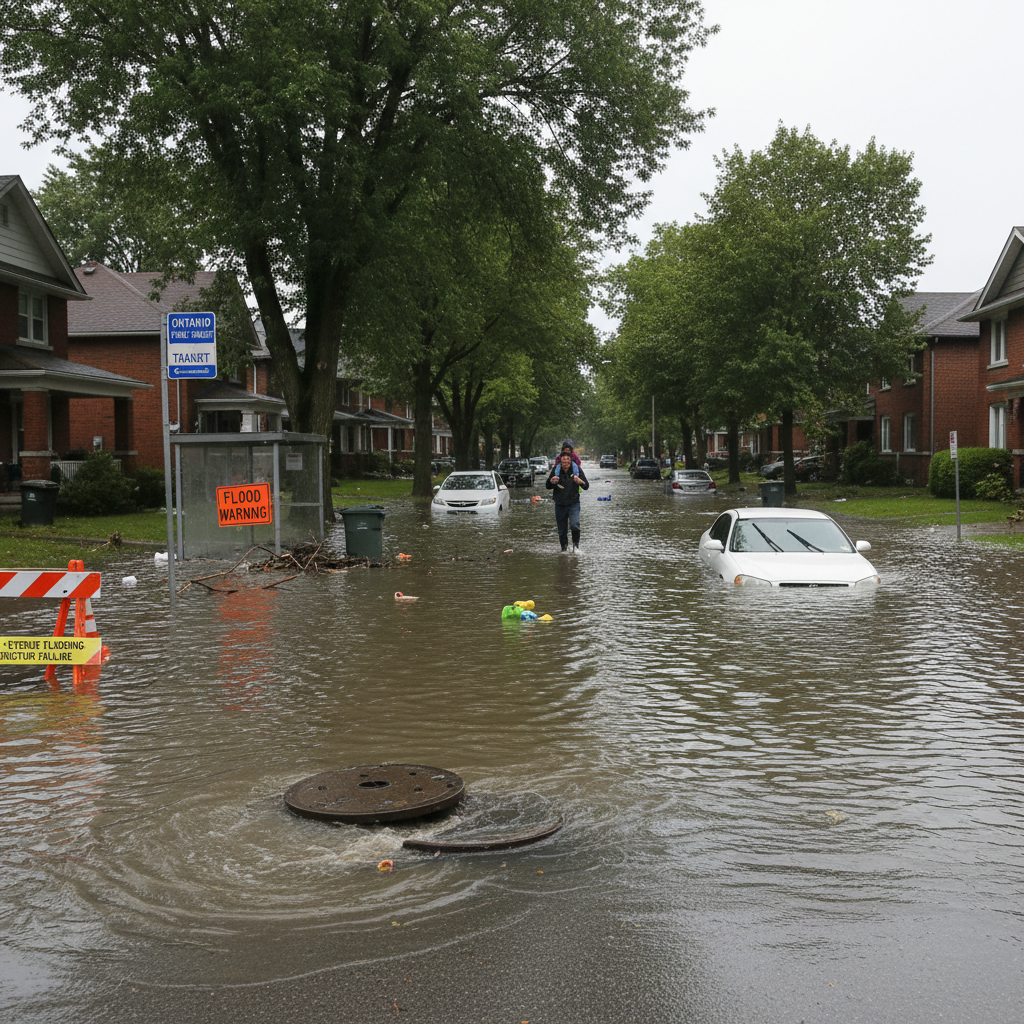
We publish articles, guides, and practical resources across five areas: healthy communities and the features that support wellbeing, healthy streets and how road design affects daily life, water, flooding, and drainage infrastructure, small town living in Ontario's smaller municipalities, and community resources covering conservation authorities, environmental regulations, and public services. Everything is written for residents, homebuyers, and anyone interested in understanding what makes some places healthier to live in than others.